Philip Kestelman is keen on measuring electoral representativity, and works in the area of family planning.
The 1937 Irish Constitution prescribes that both the President and parliamentary deputies (TDs) shall be elected "on the system of proportional representation by means of the single transferable vote". Of course, PR is not an electoral system; but a principle, to which different elections approximate to widely varying degrees.
Accordingly, the basic question is whether STV achieves PR; and if so, how far? To answer this question, we need some overall measure of electoral representativity ('proportionality'); of which the simplest is the Rose Index[12]. For reasons which will become apparent, I have renamed the Rose Index, Party Total Representativity (PTR).
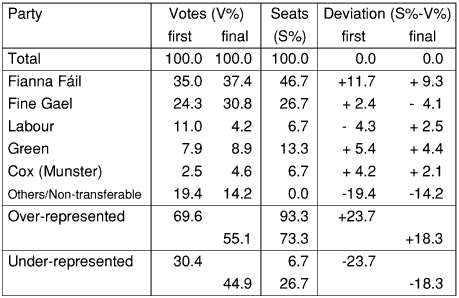
Source: Irish Times, 14 June 1994.
Thus LHI measures the total under-representation of all under-represented party-voters. Complementing LHI is the Rose Index, PTR = 100.0 - 23.7 = 76.3% of first preference votes. For comparison, in the 1994 European Parliamentary Election in Britain (First-Past-the-Post), PTR = 70.4%. This low British PTR (definitely not PR) approximated the Irish PTR (76.3%); and the corresponding STV final count PTR (81.7%) was little higher.
Cole[3] over-estimated final count PTR by excluding non-transferable votes. Moreover, non-transferable votes are under-counted by conventional STV proportionating Droop Quota surplus votes among transferable next preferences (ie. continuing candidates only[11]). Besides, "using later-stage figures overstates the proportionality of STV"[6].
In the first four European Parliamentary elections (1979-94), the Irish PTR ranged from 76.3% to 87.0% of STV first preferences; hardly more representative than the British PTR, ranging from 70.4% to 78.6%. In the 1990 Irish Presidential Election, PTR increased from 38.9% of first preferences to 51.9% of final preferences yet nobody regards AV as PR!
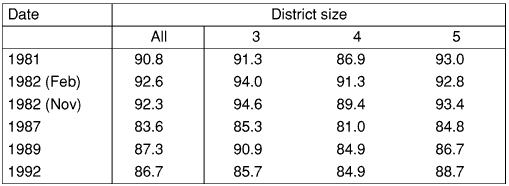
Indeed, none of the foregoing STV elections has achieved anything like PR. However, in the last six Irish general elections (1981-92), PTR has ranged from 90.1% to 96.9% of first preferences, as may be seen in Table 2.
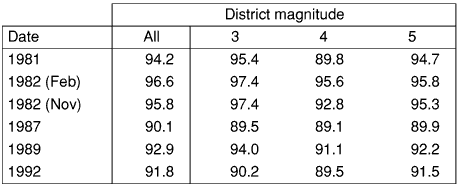
Source: Dáil Éireann [4]
Apparently, multi-member STV is only 'semi-proportional'. More remarkably, three and five member STV constituencies mediated comparable representativity. This refutes the widespread belief that "political science research establishes conclusively that PR electoral districts must elect at least four MPs before they deliver proportional outcomes"[5]. Indeed, four member STV constituencies proved invariably less representative than either three or five member constituencies, although the differences were small.
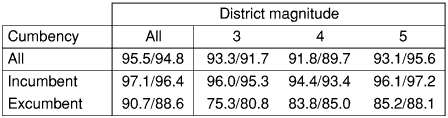
Analogously to party, consider the relationship between cumbency first preferences and seats. Instead of PTR, incumbent and excumbent candidates are treated as representing two different parties; and Cumbency Total Representativity (CTR) is calculated, as in Table 3.
Source: Dáil Éireann [4]
Such low CTRs arise from incumbents invariably over-representing their first preferences (high incumbent S%-V%). Notice the distinction between this finding and the unsurprisingly, greater electability of incumbent candidates (high incumbent S%-C%, where C% is the fraction of incumbent candidates).
Of course, incumbents are far more likely than excumbent candidates to be men. Hence the importance of disentangling cumbency from gender.
What of the relationship between votes and seats, by gender (electoral representativity proper)? In 1992, voters cast 13% of their first preferences for women candidates: slightly under-represented by women TDs (12%).
As with cumbency, we could calculate a Gender Total Representativity (GTR) for each election and district magnitude. However, because there are only two genders (non-transferable!), and so few women candidates (and hence votes for women), it seems more illuminating to aggregate the previous five general elections (1981-89); and to calculate Gender Representativity Ratios (GRRs).
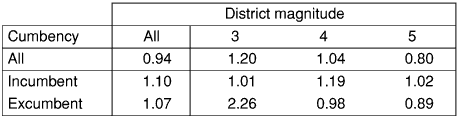
GRR is the ratio of female seats per vote to male seats per vote (first preference). Table 4 gives GRR, by district magnitude and cumbency.
Source: Dáil Éireann [4]
In 1981-89 overall, first preferences for women candidates were slightly under-represented (GRR = 0.94). However, allowing for cumbency, women TDs slightly over-represented their first preferences (excumbent GRR = 1.07).
Of particular interest, three member STV constituencies over-represented votes for women by 20% (GRR = 1.20); leaving them under-represented in five member constituencies by 20% (GRR = 0.80) overall. Among excumbent candidates in three member constituencies, first preferences for women were over-represented even more spectacularly; only 5% of votes electing 10% of the TDs (GRR = 2.26). By contrast, in five member constituencies, 15% of the voters for excumbent candidates preferred women, represented by 14% of the TDs (GRR = 0.89).
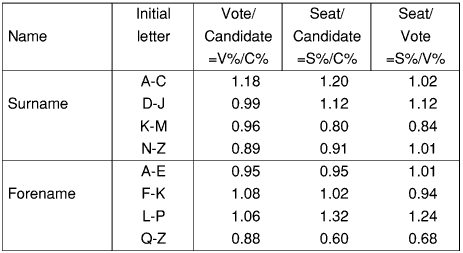
Notice that we are interested here in three distinct relationships: between candidates and votes (first preferences): between candidates and seats; and between votes and seats (electoral representativity proper). Aggregating five Irish general elections (1981-89), Table 5 confirms that higher placed excumbent candidates attracted disproportionately more first preferences (V%/C% decreasing, from 1.18 for A-C surnames, to 0.89 for N-Z surnames).
Source: Dáil Éireann [4]
Consequently, excumbent TDs over-represented candidates with A-C surnames by 20% (S%/C% = 1.20); under-representing those with K-M surnames by 20% (S%/C% = 0.80). However, notice something else: excumbent candidates with L-P forenames were even more over-represented (S%/C% = 1.32); leaving those with Q-Z forenames even more under-represented (S%/C% = 0.60). All the more remarkable, considering that forenames are not ordered alphabetically on ballot-forms; and perhaps voters' preferences for surnames were not positional, after all!
Relating excumbent first preferences to seats (electoral representativity proper), D-J surnames and L-P forenames were over-represented (by 12% and 24%, respectively); while K-M surnames and Q-Z forenames were under-represented (by 16% and 32%, respectively). How should we compare surname with forename representativities overall?
We could treat every single name-initial letter of the alphabet like a party (N=22), and calculate both Surname Total Representativity (STR) and Forename Total Representativity (FTR). Aggregating five Irish general elections again gives Table 6, comparing STR with FTR by district magnitude and cumbency.
Source: Dáil Éireann [4]
Overall, first preferences for surnames and forenames were represented with comparable fidelity (STR = 95.5%: FTR = 94.8%); again, with little difference by district magnitude. Among excumbent candidates, TDs represented surnames slightly more faithfully than forenames (STR = 90.7%: FTR = 88.6%) overall; by district magnitude, somewhat less. Altogether a muddy picture, without obvious implications for ordering candidates' names on ballot forms (surname - alphabetical or random).
Considering the quantitative notion of PR, the measurement of electoral representativity remains curiously neglected. The simplest measure of overall party disproportionality, the Loosemore-Hanby Index (LHI), complements the Rose Index, or Party Total Representativity (PTR). Indeed, PTR may be construed as the degree to which any given election - from a national aggregate down to a single member constituency - achieves PR (rarely 100%).
Single member STV (Alternative Voting) hardly mediates PR, even at the national level (as in Australia[2]). In the four European Parliamentary elections in the Irish Republic, even multi-member STV has only achieved PTRs ranging from 76% to 87%: scarcely more representative than First-Past-the-Post in Britain: ranging from 70% to 79%.
However, the last six Irish general elections (1981-92) have proved considerably more representative, PTR ranging from 90% to 97%. Thus multi-member STV alone mediates quasi-PR[15]; requiring a few additional members to guarantee PR (eg. final count best losers: 'STV-plus', as in Malta[7]).
More remarkably, Irish three and five member STV constituencies have proved comparably representative. That is good news for voters, oppressed by the lengthy ballot-forms characterising larger STV constituencies (perhaps listing 20 names). It is equally good news for reformers, dismayed at the prospect of anonymously vast STV constituencies, electing as many as seven MPs (eg. representing all three London boroughs of Greenwich, Lewisham and Southwark[13]).
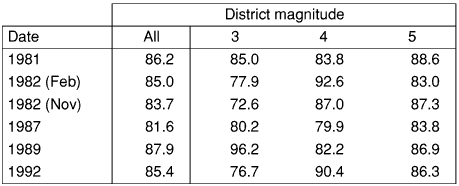
The concept of Total Representativity proves a most versatile tool, even beyond party considerations. In respect of cumbency, multi-member STV remains invariably non-PR; with Cumbency Total Representativity ranging from 82% to 88%. On the other hand, first preferences for women candidates have been represented near-proportionally; with an aggregate female-to-male S%/V% ratio of 0.94 overall. Nonetheless, three member STV constituencies over-represented votes for women, under-represented in five member constituencies.
Aggregating five Irish general elections also confirmed that excumbent candidates listed higher on ballot-forms tended to attract disproportionately more first preferences; thereby over-representing candidates with A-C surnames, and under-representing K-M surnames(S%/C%). Yet TDs over/under-represented candidates with L-P/Q-Z forenames even more steeply. Moreover, first preferences for both surnames and forenames were represented with comparable fidelity. It may not be so important to randomise ballot-forms after all: another relief for preferential voters accustomed to alphabetic order!
At best therefore, in mediating party first preferences (the main consideration), multi-member STV alone is not quite a form of PR. Nonetheless, in national parliamentary elections, Irish STV has proved far more representative than British FPP. That conclusion may be brought even closer to home, by calculating another measure (perhaps user-friendlier than PTR).
Under both AV and FPP, around half of all voters elect candidates; whereas under multi-member STV, nearly 90% of voters elect at least one representative of their preferred party. In Irish general elections, this Constituency-Represented Party Vote-fraction (CRPV) has also proved conspicuously invariant with district magnitude, as shown in Table 7.
Source: Dáil Éireann [4]
Maximising each CRPV, multi-member STV minimises vote-wastage. Thus quantifying STV's principal virtue, CRPV should allay the concern over STV - apart from its complexity - expressed by the Plant Working Party on Electoral Systems[8]. Of course, STV enjoys other virtues!